Mac Mini M6: CPU Synthetic Benchmarks
The M6 delivers a substantial 58% improvement over the M4 in Cinebench 2024 multicore, and a 27% gain in single-core.
The 24GB M6 review unit on its own. Comparisons for Cinebench are in the sections below.
Mac Mini M6
| Benchmark | MC | ST |
|---|---|---|
| Cinebench 2024 | 1,392 | 219 |
| Geekbench 7 | 22,182 | 4,016 |
| PerformanceTest | 35,789 | 6,534 |
Higher is better. M6 review unit only. PerformanceTest shows aggregate CPU Mark under MC and its separate Single Thread result (MOps/Sec) under ST.
The Geekbench 7 result and the PassMark baseline are available publicly, the latter run under PerformanceTest 11.0.1004 on macOS 27.0 with the machine identifying as Mac18,5.
Cinebench 2024
Cinebench 2024 is the primary CPU rendering test for this review. All tests use the same Cinebench version and macOS power configuration.
I am running the 24GB M6 review unit alongside the base M4 Mac Mini (10-core CPU / 10-core GPU, 16GB), with a few other devices as comparisons.
The MacBook Neo (A18 Pro) scores are from the published Neo review and desktop CPU scores below are cited from TechPowerUp and CGDirector, alongside an individual Reddit result for the 7800X3D, for comparison sake.
One logging caveat before the numbers, powermetrics on this M6 build reported 0 W for CPU package power on every run, so the M6 results have clocks, utilisation, and GPU power only.
Single-Core
The M6 Mac Mini scored . That is a 27% jump over the M4. For scale, TechPowerUp has the stock Core Ultra 9 285K at 143 and the Ryzen 9 9950X at 138, putting the Mini 53% and 59% ahead on this test. At the time of writing, those x86 parts represent the best chips Intel & AMD has to offer for the high-end desktop segment.
The M6 run took about eight and a half minutes. Busy P-cores pinned 4,788MHz and held it, with the load parked on the two 'super' cores.
Cinebench 2024 single-core, with desktop comparisons
Higher is better, with bars keyed by vendor. Sources: nyaa.sh, TechPowerUp, cgdirector, reddit
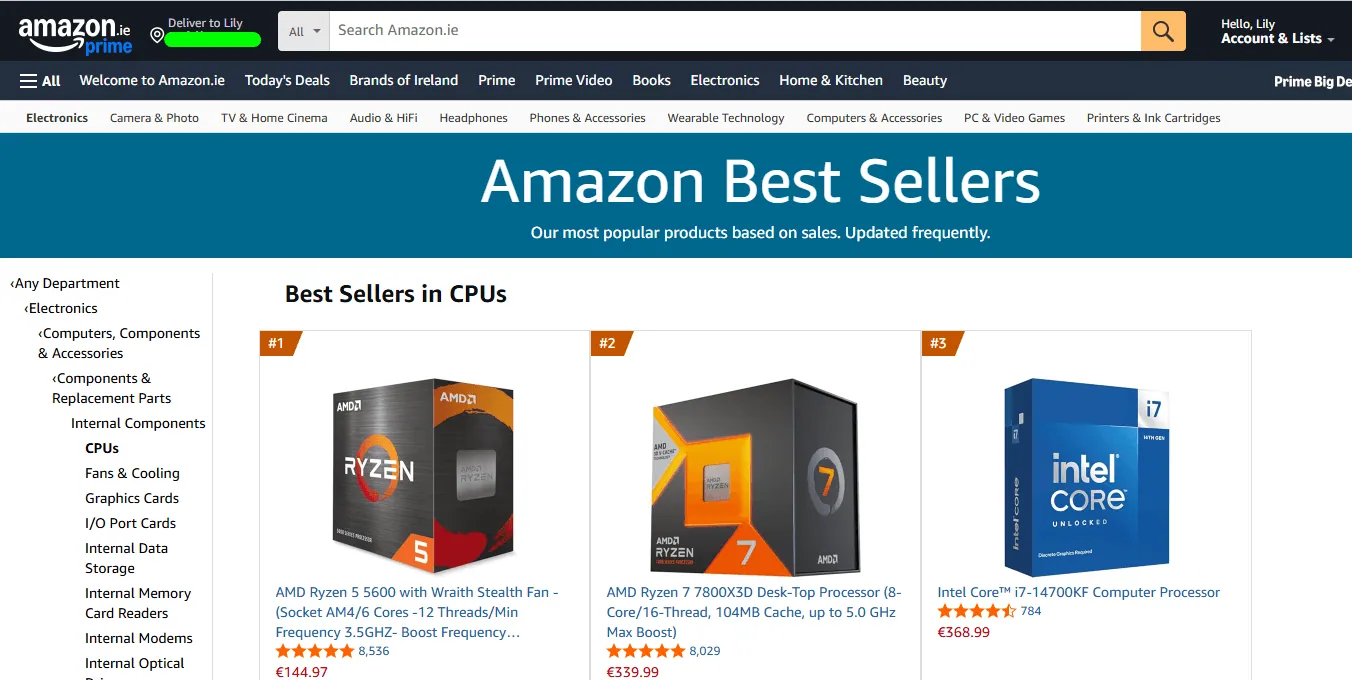
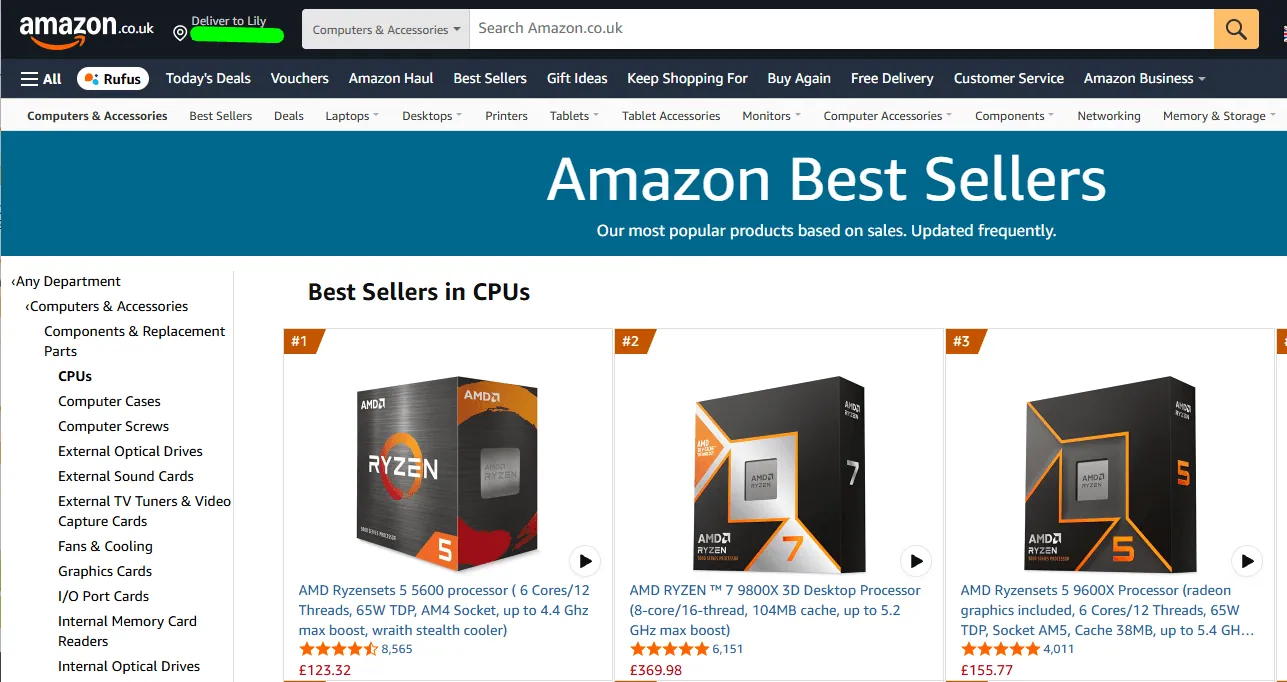
I've included these Ryzen parts because they reflect what people are buying. On September 22, 2026, the Ryzen 5 5600 topped Amazon's CPU bestseller lists in both the UK and Ireland. The 9800X3D was second in the UK, while the Irish list had the 7800X3D in second place.
Multi-Core
The M6 Mac Mini scored 1,392 points against the base M4 Mac Mini's reported 881. That's a 58% improvement against the M4, a wider gap than two extra cores alone suggests.
The M6 finished in about four minutes, with busy P-cores peaking at around 4.78GHz initially and averaging 4.61GHz across the whole run, and E-cores effectively pinned at 2.94GHz. After around 30 seconds, the peak clocks dropped to the average, but beyond that no meaningful decay in performance was observed, which hints at excellent thermal performance.
The M4 held the load for a little over six minutes with no meaningful drop. CPU package power averaged about 22W (peaking at 23W), with P-cores around 3.44GHz and E-cores around 2.89GHz. The M3 Pro ran a similar duration a little higher, averaging about 24W and peaking near 26W.
Cinebench 2024 Multi-Core
| Chip | Score | Avg Package Power | Peak Package Power |
|---|---|---|---|
| M6 | 1392 | Not reported | Not reported |
| M4 | 881 | 22 W | 23 W |
| M3 Pro (Binned) | 900 | 24 W | 26 W |
| A18 Pro | 426 | 4.5 W | 6.5 W |
Higher score is better. Single Cinebench 2024 runs on this bench. Neo is the published figure from the Neo review (battery, settled ~4.5W after a ~6.5W peak). M6 CPU package power was logged as zero by powermetrics.
The same TechPowerUp review has the stock Core Ultra 9 285K at 2,448 and the Ryzen 9 9950X at 2,305 for multi-core, putting them 76% and 66% ahead of the M6. This is to be expected, the 285K is a 24-core part and the 9950X has 16 cores, which pull between 170-250W respectively at stock configurations.
For another desktop comparison, the Ryzen 7 9800X3D scores 1,372 multi and 134 single according to TechPowerUp. That puts the M6 just 1.5% ahead in multi-core, effectively level, and 63% ahead in single-core.
The 7800X3D figures come from an individual result on r/buildapc, with the poster reporting stock CPU settings, DDR5-6000 CL30 with EXPO I, and a 30-minute test. The Ryzen 5 5600 scores are from CGDirector’s Cinebench 2024 table.
Cinebench 2024 multi-core, with desktop comparisons
Higher is better. Bars keyed by vendor. Ryzen 7 7800X3D: individual Reddit result. Ryzen 5 5600: CGDirector, with test configuration unspecified. Other x86 figures: stock results from TechPowerUp's Core Ultra 9 285K and Ryzen 7 9800X3D reviews. Sources linked above.
I captured live telemetry during each run using powermetrics. The Neo traces are the ones from that review. Use the dropdown to switch machines and SC / MC.
Cinebench 2024 Power & Frequency Telemetry
Captured via powermetrics at ~1s intervals on macOS. Traces cover the rendering run plus a short cooldown; idle logging after the comparison-system runs has been trimmed. The M6 traces report no CPU package power, so only clocks and utilisation are plotted for that machine.
Performance per Watt Is on Hold
I cannot make a meaningful M6 performance-per-watt comparison yet because powermetrics reports zero for CPU package power on this build. I'll revisit this once reliable power readings are available.
Experimental Benchmark Explorer
If you want to put these results alongside other machines, I’m experimenting with a benchmark explorer below. You can switch tests and choose comparisons from the wider results library, with the M6 highlighted.
Single-threaded CPU render score. The closest proxy available for per-core performance. Higher is better. Percentages are measured against the Mac Mini M6. Colour follows the CPU vendor.